
Lower-body injury data was acquired from "NFL 1st and Future - Analytics" (Kaggle)
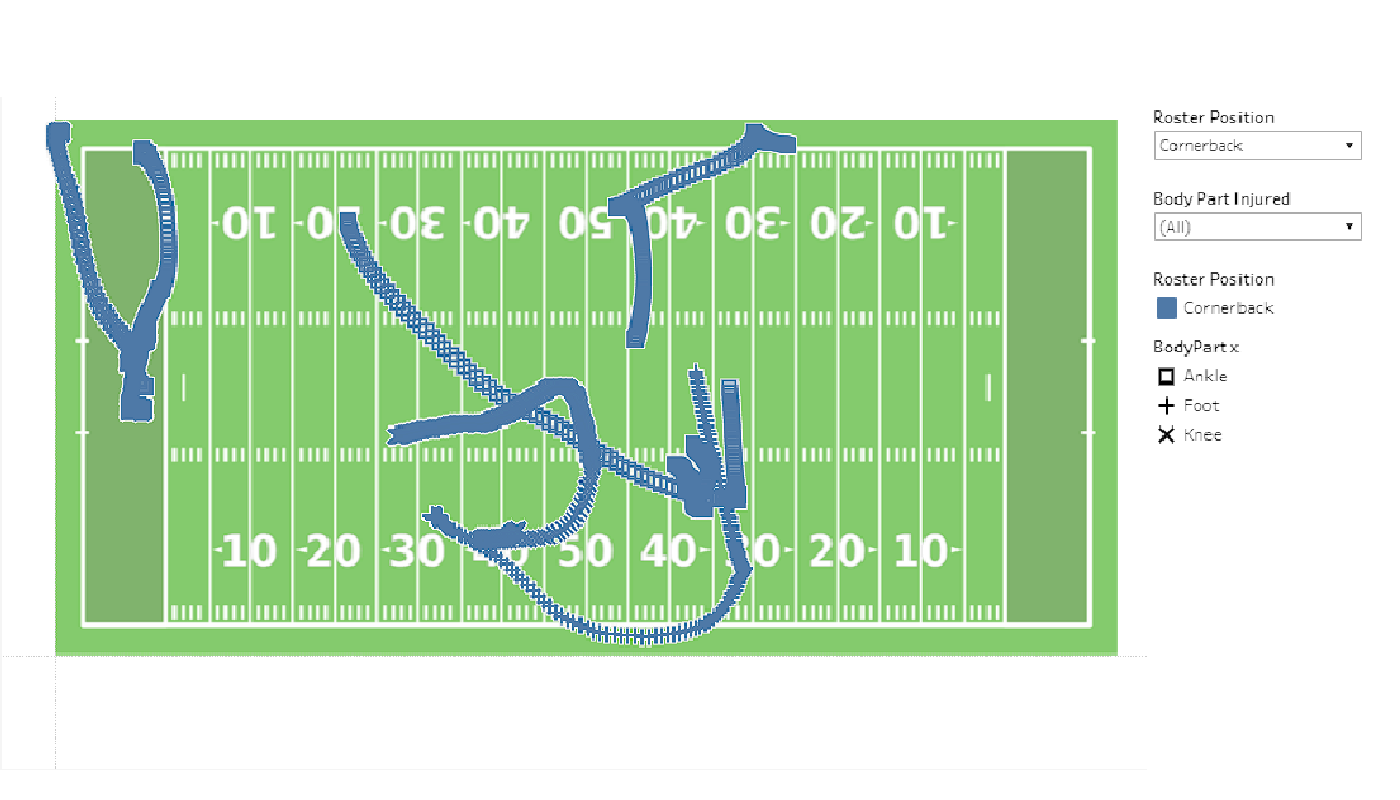
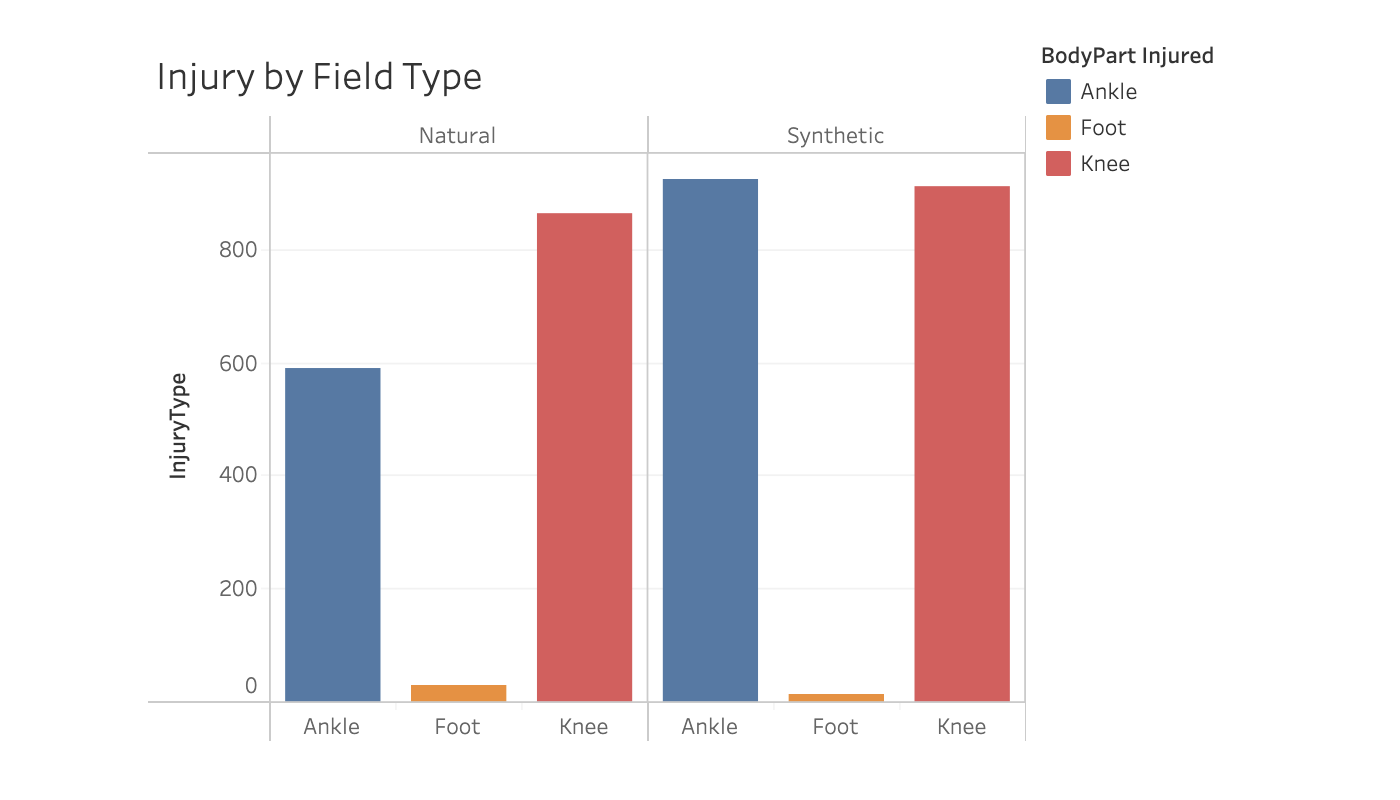
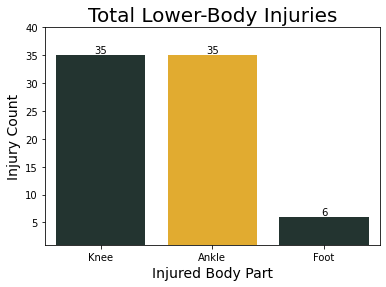
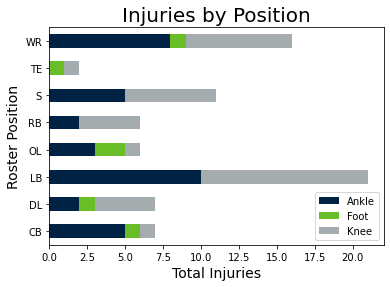
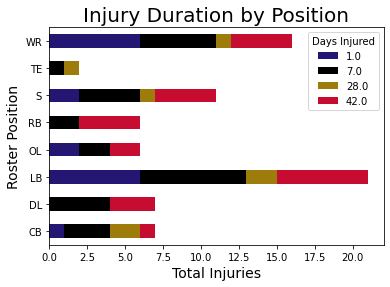
The data from this competition provided information on gross physiological injuries, such as foot, knee, and ankle injuries across 2 seasons. While the purpose of the competition was to assess the injuries with respect to the turf of the field, our intention was to use these data to assess all parameters correlating with these types of injuries compared to the concussion data from the other datasets.
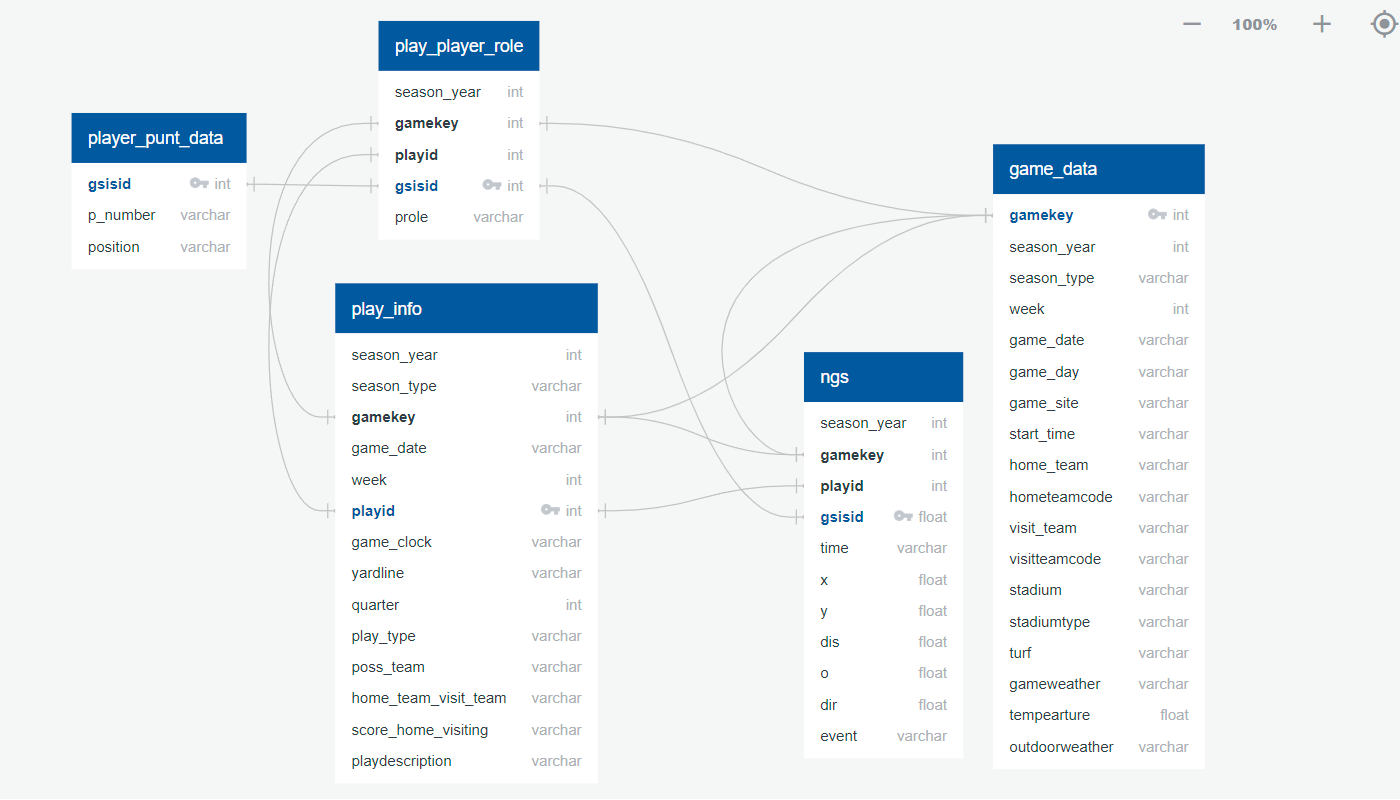
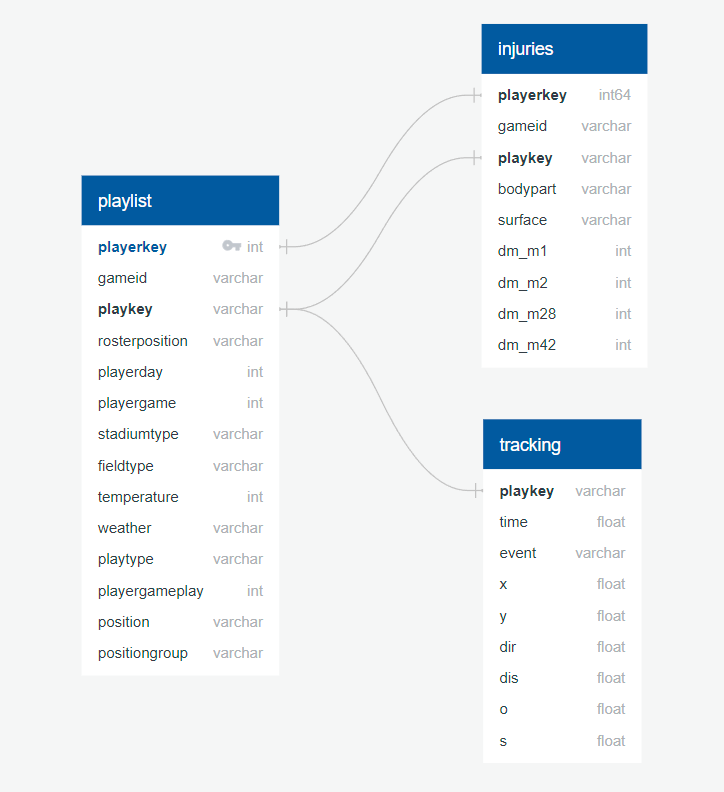
These data were stored in a PostgreSQL database, using SQL Alchemy to pull the data from each table for processing, with the exception of the tracking data. The size of the tracking data was prohibitively large for SQL Alchemy on a local server, with over 76 million rows. To import this data in the Python files, the data table was downloaded as a csv file from the SQL server into a folder labeled NFL_Turf, prior to being read into the Python file. The data were connected with the following Entity Relational Diagram (ERD).
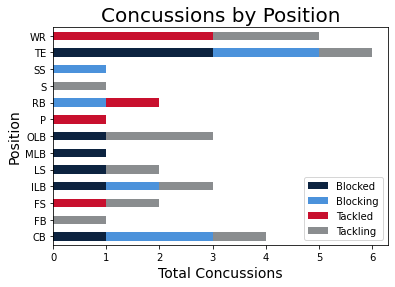
Concussion data was acquired from "NFL Punt Analytics Competition" (Kaggle)
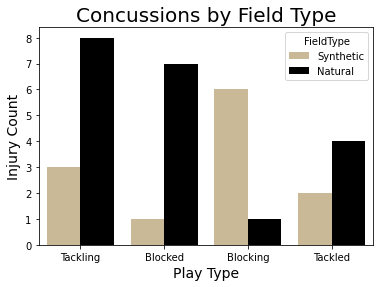
The data from this competition provided information regarding concussions during punt plays across 2 seasons. Our goal was to use these data and investigate the parameters in comparison with those from the lower-body injuries. We used 5 of the complete datasets available from the source. Upon storage in our database, 4 tables were merged using PG Admin and used to create a new table called punt_analytics. This table was imported into the Python files using SQL Alchemy as were done with the Injury tables. Also similar to the Injury data, the ngs table (tracking data) was too large to import using SQL Alchemy and again were downloaded locally and imported to Python using Pandas into a folder labeled NFL_Punt. Only the original data are represented in the ERD.