
In recent years, more concern has grown over sustained injuries that impact the athletes lives long after their athletic careers end. The NFL is looking to identify what changes should be made to minimize the risk of player injury, while not completely altering America's favorite pastime. There are several types of injuries that are incurred - there are gross physiological injuries such as knee, foot, and ankle injuries, and there are also more subtle injuries such as concussions, which can have a much longer-lasting impact on the players, occasionally leading to personality changes and unfortanately, even suicide. It's clear that changes need to be made to address these concerns, but the conflicting view is that the NFL is a multi-billion dollar industry, generating a revenue of over 17 billion dollars in 2021 alone. While changes need to be made, they only impact a fraction of the players. In order to minimize the risk of all players, it's important for the NFL to maintain most of the features of the game if they can modify only certain aspects in order to better ensure the medical safety of their players.
There are several questions we seek to answer:
To address the lower-body injuries, we applied Random Forest Machine Learning models and Neural Network models, as with these data we had a large control group of non-injured players. To address the concussive injuries, we ultimately used Principal Component Analysis (PCA) in conjunction with K-Means Clustering to determine the major groupings of the concussion injuries. Subsequently, we used a supervised Random Forest model to identify the primary features that separate the classifications.
The data sources are from two Kaggle Challenges:
The first sets of data provide information on gross physiological injuries such as foot and knee injuries, whereas the second sets of data provide information regarding concussive injuries. It is likely that the conditions for each of these types of injuries are different, so this will involve a multi-step analysis to assess the parameters that have the highest impact on each type of injury and the severity of the injuries.
We hypothesize that there is a relationship between the field conditions, player position, time during the season, duration of play during the game, location on the field, and the orientation the player is facing with respect to the direction of their movement (twist) that can predict the occurrence, type, and severity of lower body injury.
We also hypothesize that there is a relationship between the field conditions, player position, location, time within the season or game, the orientation the player is facing with respect to the direction of their movement (twist), as well as the impact of home/away games and the point distribution at the time of injury that correlates with the incidence of traumatic brain injuries.
We additionally anticipate that some of the features that lead to the lower-body injuries will overlap with those of the concussion injuries.
The Injury dataset was pulled directly from the SQL database using SQL Alchemy to pull the data from each table for
processing, with the exception of the tracking data. The size of the tracking data was prohibitively large for
sqlalchemy on a local server, with over 76 million rows. To import this data in the Python files, the data table was
downloaded as a csv file from the sql server into a folder labeled NFL_Turf, prior to being read into the python
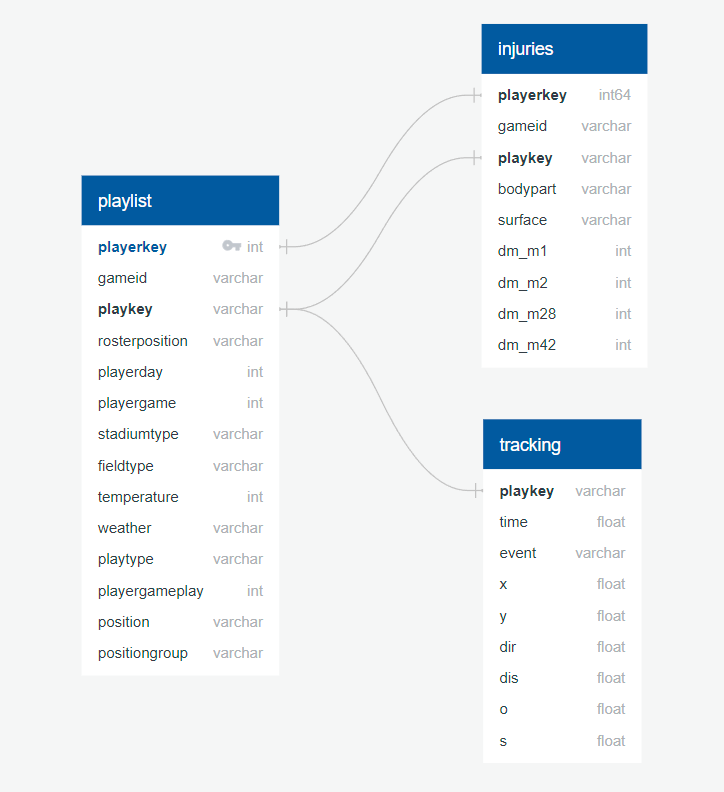
file. The data were connected with the following Entity Relational Diagram (ERD).
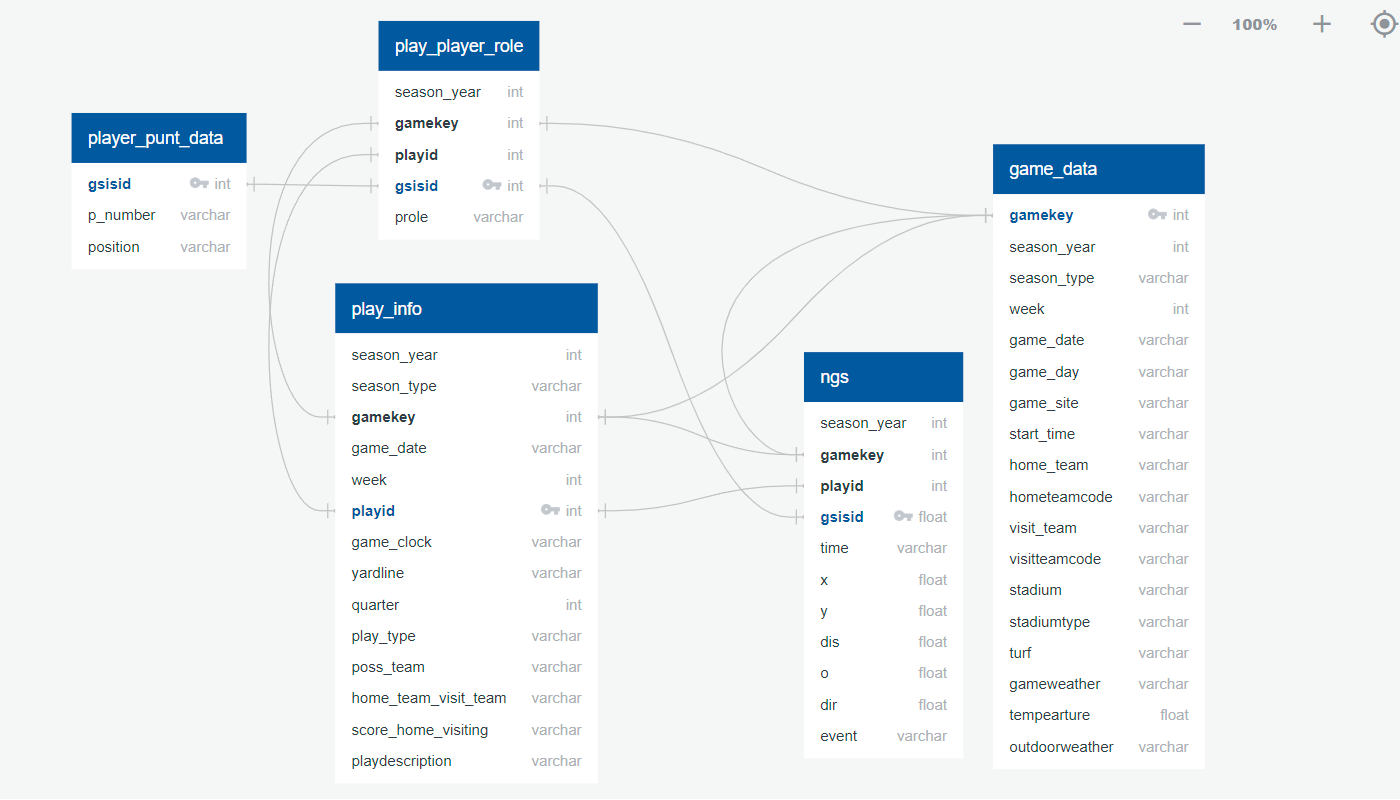
For the Punt Analytics dataset, 4 tables were merged using PG Admin and used to create a new table called punt_analytics. This table was imported into the python files using SQL Alchemy as were done with the Injury tables. Also similar to the Injury data, the ngs table (tracking data) were too large to import using SQL Alchemy and again were downloaded locally and imported to python using pandas into a folder labeled NFL_Punt. Only the original data are represented in the ERD.
This section refers to the python files used for data cleaning in the different analyses, found in the repository
Several key factors have been clearly demonstrated
with visualizations produced both using Python and Tableau:
During the creation of visuals both in Tableau and using MatplotLib, we were able to work through the datasets in search of any correlations that may lead to insight in factors associated with the injuries:
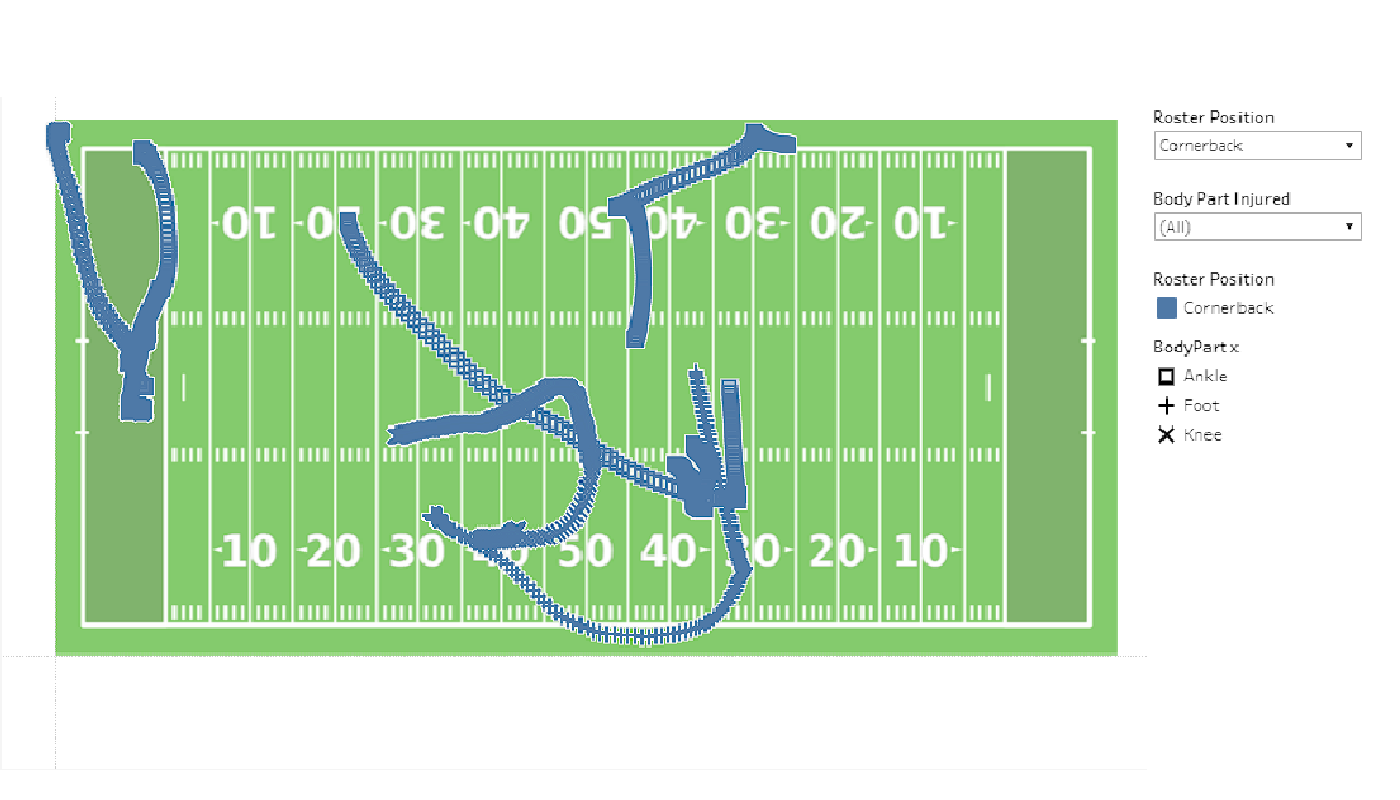
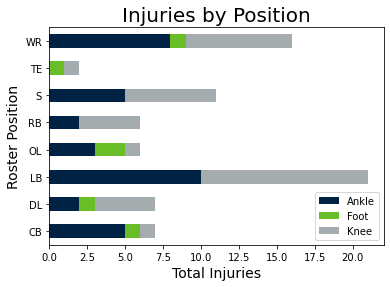
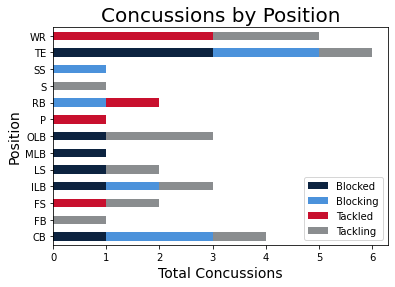
Which parts of the field were more prone to the different types of injuries?

Where on the field different certain defensive and offensive positions were sustaining more injuries and
where they were least likely to occur?

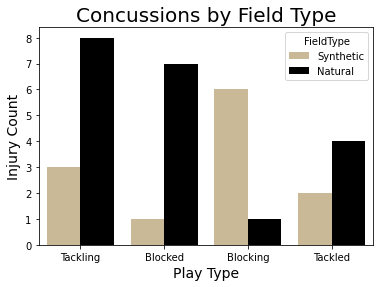
What plays incurred which types of injuries?

What happened the moment before the injurious play ended?

We noticed that concussions in punt plays alone vastly outnumbered the lower-body injuries in a 2 season
period.
The temperatures with the highest number of injuries were 68 and 70 degrees - though it should be noted that indoor fields are kept at these temperatures, so it may not be a valid predictor of injury.


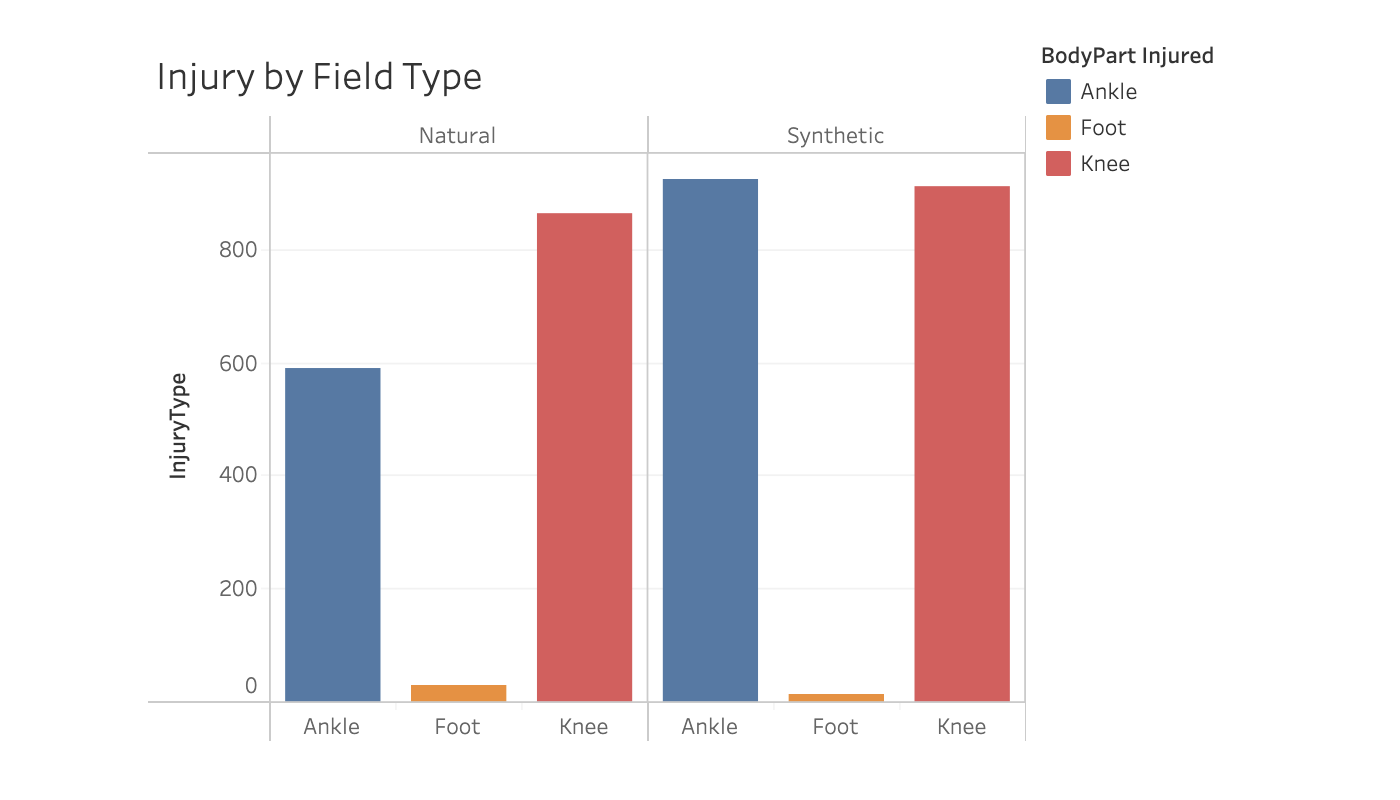
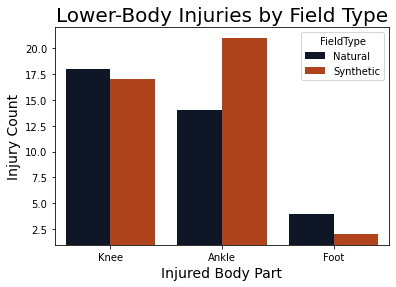
There was a correlation with severe injuries, resulting in over 4 week recovery and synthetic turf

Implementing the interactive models using Tableau allows a user to select from different parameters (position, injury type, etc.) and see the movement of a player on the field to give better depth in understanding of how the injury was sustained.
In the future, we would like to create a visualization to the the direction of movement and player orientation with vectors throughtout the play to show the player's path prior to concussion - as the twist was the primary factor that correlated with the learning model.
The Machine Learning Design was broken up into two parts, as the Lower-Body Injury data and Concussion data presented different aspects that only allowed for different types of machine learning analyses. The final Model Designs were as follows:
The lower-body injury analysis was a very unbalanced dataset containing a small number of injuries with a large set of plays without injuries. The data without injuries functioned as a control group used for classification in a supervised analysis. The initial model used Random Forests, as it produced a very high accuracy. However, the precision was the more important consideration with the imbalanced data, and the neural network model provided a much higher precision than did the ensemble learning.
All instances of the concussion data were incidents with concussions, preventing us from using a supervised model. The best results were achieved with a PCA feature extraction, reducing the features to 3 dimensions, more ideal for visualization. Following the feature extraction, K-Means clustering was used to classify the data into the groups. Both a dendogram and an elbow curve were used to determine the number of cluseters to use. Because of the ambiguity incurred with the feature extraction, we used a Random Forest classifier to determine which features had the strongest association with each of the outputs.
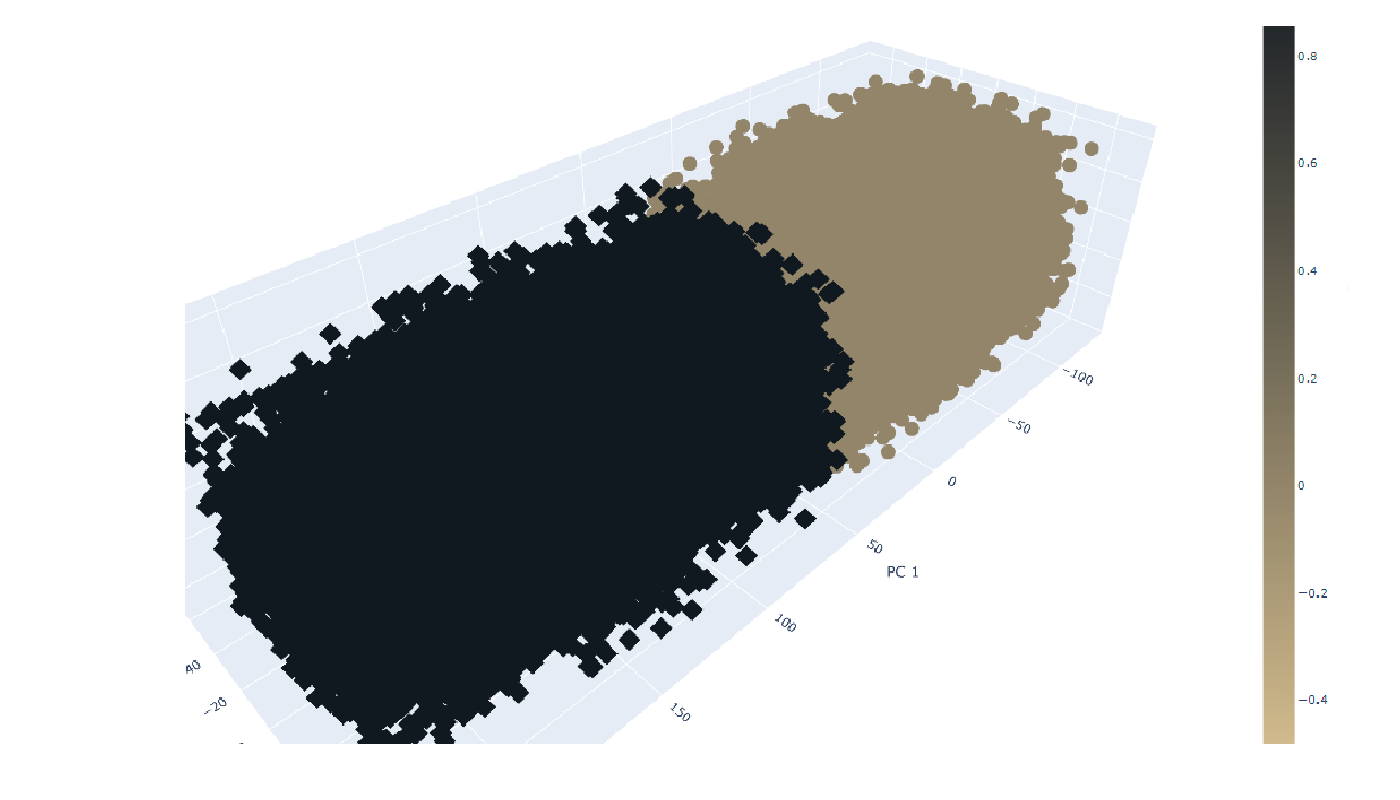
We initially used unsupervised learning to see what features would lead to clusters with the Injury data. K-Means Clustering was used to perform the unsupervised analysis, using a PCA feature extraction to group the features to 3, for the ability to create a 3D visualization. The initial model analyzed all of the data, including all plays without injuries and those with injuries. To determine the ideal number of k classifiers, we employed an elbow-curve analysis. There was a strong curve delineation at k=2, so this was performed and shown below.


Unfortuantely, the injuries were not successfully classified, and the differences between the groups largely had to do with the number of games played. The next model removed all of the non-injury data from the dataset, to try to isolate the features that had the greatest influence on these data. The main joints occurred at k=3 and k=6. The grouping with k=3 left one group with very ambiguous correlations, so the results from the k=6 analysis are reported below.

The following files are a composite of those in the Preliminary Models, and are themselves contained in Machine_Learning_Files:
These initially analyses did not incorporate tracking information. The goal was to determine whether the features not including the tracking data could provide a model with high enough accuracy and precision.
Due to the nature of the Injury Dataset being extremely imbalanced, we used the Balanced Random Forest Classifier from the imbalanced learn library. In preparing the data for processing, the positions were encoded in a single column by numbers, as described above, however the plays were encoded with OneHotEncoder, giving us 3 columns for each of the plays.
The original dataset contained 260,000 rows with only 77 injuries. Because of this large difference, we tried several approaches, including Undersampling and SMOTEENN, but ultimately, we just split the data using train_test_split() from the scikit learn library both with and without stratification.
Determine whether an injury occurred
The original model achieved a 58% accuracy and worse precision. We further analyzed the feature importances.

The next analyses utilized a Complement Naive Bayes analysis; this type of Naive Bayes is more suitable for extremely imbalanced datasets. Similar to the Random Forest model, the results only provided a 58% accuracy. Likewise, an EasyEnsemble Boosting algorithm was tested again with similar results. From these analyses, we concluded that additional information would be necessary to further improve our models. The Random Forest and Complement Naive Bayes are shown below:

Futher development of the dataset included the spatial parameters that should gave more predictive capability, indicating the great impact on the potential for injury. Using these data with random sampling the non-injury data were reduced to achieve a 100:1 distribution from the 3000:1 distribution we started with. Once the spatial data were added, this dataset expanded substantially, making a big impact on processing. Each of the Random Forest models was able to predict with 99% accuracy, and few to no false negatives:
Was there a severe injury?

What body part was injured?

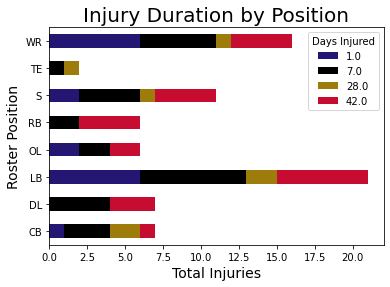
How long was the player out?

From the outputs of the Machine Learning models and the exploratory analysis, graphics for the dashboard will be created using a combination of python generated plots and interactive features, which will be imbedded into a webpage using JavaScript, HTML, and CSS.
The following is the primary file used for this analysis:
Was the player injured?
The adaptations from the original model to the final models for the Injury Data was the addition and cleaning of the
tracking data. With the addition of the tracking information, the Balanced Random Forest Classifier with 10
estimators provided a 99.96% accuracy, a much higher accuracy than was achieved with the any of the models not
including the tracking data. With the addition of the tracking data, the number of rows increased to several
thousand. In addition to the 99.97% accuracy, this model yielded under 5 false negatives, and 145 false positives
from the dataset including 550,000 true negatives and 5500 true positives.
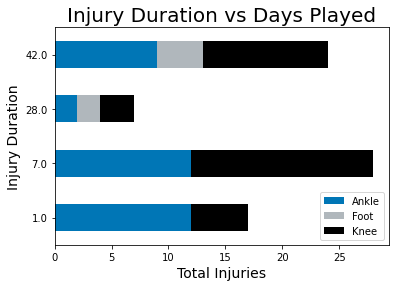
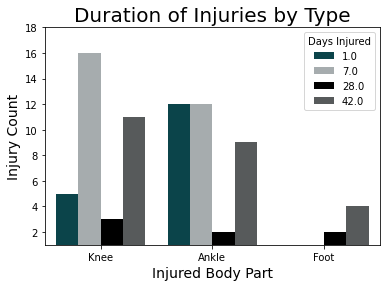
In the feature analysis, we confirmed that the strongest feature in the feature analysis was the number of days played, closely followed by the temperature, and the time of the play during the game. Other stronger predictors were the player's position and the location along the length of the field.

Was the injury severe?
The same process as above was followed, yielding a 99.97% accuracy and a lower, 90.35% precision.

What type of injury was predicted?
The overall accuracy of this model with 4 outputs was again 98.59%, but the precision started to really drop:

What was the predicted duration of injury? The overall accuracy remains high at 99.77%, but the precision continues to drop:

The Random Forest Classifiers predicting multiple outcomes were more difficult to predict the accuracy and recall specifically, and they were not possible to evaluate like this for the neural network model. These results were summarized in the following table:

In the final model, there were some changes made from the preliminary models:
Several different parameter configurations were tested with the neural networks, starting with the lowest complexity - a single layer with increasing numbers of nodes - to higher complexity - two layers with increasing the numbers of nodes in either layer. The final model used 256 nodes in the first hidden layer and 128 nodes in the second hidden layer of a sequential model. The hidden layers each used Relu activation and a Sigmoid output. Compiling used a binary crossentropy loss model because each of the outputs were binary outcomes, as opposed to a categorical crossentropy model. Though there were categorical ouputs in some of the models, each of the outputs remained a binary classification. The optimizer used was an adam optimizer. In order to compare the outcomes of this model with the Random Forest model, the metrics tracked were accuracy, precision and recall.
The Tests Performed:
The Results:

Similar to the Injury Analysis, the tables were merged including the tracking data, creating a very large dataset. In order to perform the clustering analysis, there are several ways to break the data into different clusters. The first approach was using Agglomerative Clustering, which required a size reduction to create a dendogram. The dendogram shows the highest break at two, followed by three clear clusters.
This analysis was performed with 3 clusters prior to breaking up into two sets using train_test_split for feature classification. A Balanced Random Forest Classifier was used with 100 estimators to determine which features have the highest correlation with the different classes. In this case, the highest correlation was the Twist, the difference between the orientation of the player and the direction of movement.

Following the Agglomerative Clustering, we used PCA data extraction to reduce the dimensions to 3 components. Testing
for the ideal number of clusters for K-Means analysis, we utilized an elbow curve, where there was a very distinct
bend at k=2. The K-Means clustering was performed with 2 clusters. The K-Means analysis was plotted using hvplot as
shown below:


The highest predictor was, again, the Twist, with about 98% importance with the feature analysis.
Considerations that were made during these analyses.
Because of the nature of the analyses being of medical nature,
and furthermode the investigations were of the presence, identification and duration of injuries, the measure of
accuracy is not a particularly reliable measure. While accuracy is important, it only highlights how accuate the
models were in identifying the non-injured players. In fact, if the model had miscategorized all of the injured
players as non-injured, the model would still achieve a 99.97% accuracy based on the balanced accuracy report due to
the imbalance in the number of true positive and true negative values. The validation test results without the
positional data only contained 18 injured values, but 59098 non-injury plays for comparison.
In this study, the precision is a much better statistic to measure, as it looks at the True Positives compared to all Positives labeled (True Positives + False Positives). Recall, on the other hand, is the ratio of True Positives to True Measurements (True Positives + False Negatives). The prediction of a False Positive is much more desirable than the prediction of a False Negative. A False Positive signifies that the model predicted an injury when no injury occurred, whereas a False Negative predicts that no injury occurred, when one actually did. Our interpretation of the the False Positives in the findings were that those plays could be classified as "High Risk" plays: since the model predicted them as plays associated with injuries, all of the features that could lead to an injury were there, but no player incurred an injury. A False Negative, on the other hand, would suggest that the model is insufficient in its predictive capabilities. Therefore, our goal was to achieve a model with the highest possible precision in the predicition of injury, injury types, and severity of the injury.

Our findings address the questions both within the datasets and between the datasets, answering the original questions we posed:
Are the lower-body injuries strictly associated with non-spatial features across the football field?
Which features had the strongest correlations with the lower-body injuries and the concussive injuries?
Are there similar features between the concussion and lower-body injury datasets that could be addressed for overall safer play?
Are there any predictors to whether an injury is more or less likely to impair a player for over four weeks?
Can we accurately and precisely predict which types of injuries are prone to occur given the set of features we have used to train a machine learning model?
We would like to further assess the predictive capabilities of which exact conditions would both maximize and
minimize the chances of injury. Our current model can predict whether certain given parameters will predict high
risk or injury. To do this we will need to perform Regression analyses to determine what Temperatures parameters
lead to injuries, in order to best inform the NFL and players what precautions to take.
Limitations of our Neural Network model is the ambiguity associated, while it was easier to extract feature
importances from the Random Forest algorithm, we have not been able to directly extract the feature importances from
the Neural Network model. In future analyses, we would like to remove the lowest impact features found with the
Random Forests analyses to see whether we can maintain the high accuracy and precision with the deep learning model,
better reinforcing our understanding of the feature importance of the model.
Finally, our concussion analysis was unsupervised because of a lack of control data without sustained concussion
injuries. Although the data from the lower-body injuries and the concussion injuries were collected from two
different sets of years, we do have information from the lower-body dataset of many plays with the same known
parameters where no injuries were incurred. We would like to use these data to create a predictive model extracting
only the non-injury punt plays from the initial dataset to use to establish a Predictive Supervised model with a
more robust feature analysis for the concussion dataset.